
 搜索
搜索 阅读量:
阅读量: 收藏数:
收藏数: 点赞数:
点赞数:
第四章 图形基本形状
在图形系统中,基本形状是指一些简单的二维形状,例如点、线、矩形、圆形等。这些基本形状是构建复杂形状和图像的基础元素。
基本形状可以通过各种方式进行组合、变换和修改,以创建更为复杂的形状和图像。例如将一个矩形旋转一定角度来得到一个新形状。
基本形状也具有一些属性,例如位置、大小、颜色等,这些属性可以通过编程进行修改和操作,以实现各种视觉效果和图形设计。
在计算机图形学中,基本形状通常是用数学公式来表示的,例如圆形是由一个中心点和半径组成的,矩形是在由一个点和矩形的宽高组成的。这些数学公式可以方便地对基本形状进行操作和变换,从而实现各种复杂的图形效果。
1 GIS系统和SVG中的基本形状
GIS系统和SVG是图形系统中的两个分支,目前已存在大量的应用,也已经由国际权威机构制定了相应规范,我们先看一下GIS和SVG中的一些基本形状:
(1) GIS中的基本形状
在GIS(地理信息系统)中,基本形状通常包括点、线、面等几种类型。
点实体在GIS中可以表示为具有坐标和属性信息的实体,如建筑物、交通枢纽、自然物体等。
对于线实体,在GIS中可以用一系列坐标对表示,这些坐标对代表了线的位置点。线实体可以用来表示各种线性特征,如道路、河流、山脉等。
多边形是GIS中的另一种基本形状,它是由一条或若干条闭合的线段组成的图形,用于表示边界完全闭合的空间区域。多边形可以用来表示重视大小和形状这两个特征的地理对象,如城市边界、公园、建筑或水体等。
下面列出了OpenGIS中的几种基本形状:
| 类型 | 名称 | 示例 |
|---|---|---|
| Point | 点 | Point (10 10) |
| LineString | 折线 | LineString (10 10, 20 20, 30 40) |
| Polygon | 多边形 | Polygon ((10 10, 10 20, 20 20, 20 15, 10 10)) |
| MultiPoint | 多点 | MultiPoint ((10 10),(20 20)) |
| MultiLineString | 多线 | MultiLineString ((10 10, 20 20),(15 15, 30 15)) |
| MultiPolygon | 多面 | MultiPolygon (((10 10, 10 20, 20 20, 20 15, 10 10)),((60 60, 70 70, 80 60, 60 60 ))) |
(2) SVG中的基本形状
SVG(Scalable Vector Graphics)是一种基于XML的二维矢量图形标准,它支持多种基本形状,如下表所示:
| 类型 | 名称 | 示例 |
|---|---|---|
| rect | 矩形 | <rect x="100" y="100" width="400" height="200" fill="yellow" stroke="green" stroke-width="10"/> |
| line | 线 | <line x1="100" y1="300" x2="300" y2="100" stroke-width="5"/> |
| polyline | 折线 | <polyline fill="none" stroke="blue" stroke-width="10" points="50,375 150,375 150,325 250"/> |
| polygon | 多边形 | <polygon points="100,100 150,25 150,75 200,0" fill="none" stroke="black" /> |
| circle | 圆 | <circle cx="200" cy="200" r="100" fill="red" stroke="blue" stroke-width="10"/> |
| ellipse | 椭圆 | <ellipse cx="30" cy="5" rx="8" ry="4" fill="url('#linear2')"/> |
| path | 路径 | <path fill="none" stroke="red" d="M 10,30 A 20,20 0,0,1 50,30 A 20,20 0,0,1 90,30 Q 90,60 50,90 Q 10,60 10,30 z "/> |
| text | 文本 | <text x="250" y="180" font-family="Verdana" font-size="64" fill="blue">Hello world!</text> |
| image | 图像 | <image xlink:href="http://168.9.202.125/graph/data/bird.png" width="199" height="224"/> |
| use | 符号引用 | <use xlink:href="#eye" stroke="silver" fill="gray" width="80" height="80" x="300" y="20"/> |
2 anyGraph 基本几何对象
anyGraph 的目标是成为一个通用的WEB前端图形开发引擎,因此其包含的基本几何形状与SVG比较相似,包含常见的点、线、面几方面基本几何形状。
基本几何对象源码位于 src\geom 目录。
classDiagram
Geometry <|-- Point
Geometry <|-- Rect
Geometry <|-- Polyline
Geometry <|-- Polygon
Geometry <|-- Circle
Geometry <|-- Ellipse
Geometry <|-- Image
Geometry <|-- Text

Geometry : String uid
Geometry : Enum type
Geometry : float rotation
Geometry : Object style
Geometry : Object properties

Point : float x
Point : float y
Point : float size
Point : int pointType

Rect : float x
Rect : float y
Rect : float width
Rect : float height
Rect : float rx
Rect : float ry
Rect : toPixel()
Rect : getBBox()
Rect : draw()
Rect : container()

Circle : float x
Circle : float y
Circle : float radius
Circle : toPixel()
Circle : getBBox()
Circle : draw()
Circle : container()

Ellipse : float x
Ellipse : float y
Ellipse : float rx
Ellipse : float ry
Ellipse : toPixel()
Ellipse : getBBox()
Ellipse : draw()
Ellipse : container()

Polyline : floatArray coords
Polyline : toPixel()
Polyline : getBBox()
Polyline : draw()
Polyline : container()

Polygon : floatArray coords
Polygon : toPixel()
Polygon : getBBox()
Polygon : draw()
Polygon : container()

Image : float x
Image : float y
Image : float width
Image : float height
Image : toPixel()
Image : getBBox()
Image : draw()
Image : container()

Text : float x
Text : float y
Text : float width
Text : float height
Text : toPixel()
Text : getBBox()
Text : draw()
Text : container()
(1) Geomertry
Geomertry 是基本形状的根类,是一个抽象的(不可实例化的)类。包含了基本几何形状通用的属性和方法。
Geomertry 类非常重要,掌握了该类,就能更容易理解 anyGraph 的几何对象类型,以及理解 anyGraph 的图形渲染过程。
其重要属性包括:
| 名称 | 类型 | 说明 |
|---|---|---|
| uid | String | 唯一ID |
| type | String | 类型 |
| rotation | float | 旋转角度 |
| style | Object | 样式 |
| properties | Object | 属性 |
其基本的方法包括:
| 名称 | 说明 |
|---|---|
| getUid() | 获取对象ID |
| getType() | 获取对象类型 |
| getStyle() | 获取对象样式 |
| setStyle(style) | 设置对象样式 |
| draw(ctx, style, frameState) | 绘制对象图形(需各个子类实现) |
| toPixel() | 转换为屏幕坐标 |
| getBBox() | 获取对象边界 |
| contain(point) | 判断某点是否在当前对象的边框内 |
| clone() | 克隆对象 |
| toData() | 获取当前对象属性 |
下面讲解几个常用的方法:
draw()
1 | draw(ctx, style, frameState) |
该方法由各子类来实现,负责将图形绘制在Canvas中,包含了3个参数:
| 名称 | 说明 |
|---|---|
| ctx | Canvas渲染上下文对象 |
| style | 图形样式,该样式为渲染时的样式 |
| frameState | 当前图形信息 |
toPixel()
1 | toPixel(tool) |
该方法由各子类来实现,负责将图形坐标转换为Canvas像素坐标,其参数为 “变换矩阵” 。
setStyle()
1 | setStyle(style) |
该方法可修改对象的样式,其参数为 样式对象,虽然该对象的样式存储在其内部变量 style 中,但该方法仅修改参数中的指定的属性,而不是该对象样式的所有属性。例如该对象当前样式为 {"color":"red", "fillColor":"blue"},如果参数为 {"color":"gree"},则结果仅改变样式中的color属性,而不改变fillColor属性。
getBBox()
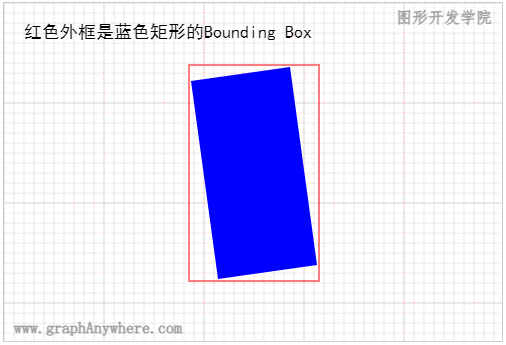
该方法返回该对象的 Bounding Box, 即矩形边界框,它是一个矩形框,用于包围当前形状。通常采用 [minX, minY, maxX, maxY] 格式记录Bounding Box。对于三维图形又叫包围盒,对于二维图形又叫包围矩形;
如下图所示的红色框即为该对象的 Bounding Box。
contain()
1 | contain(point, useCoord = true) |
该方法判断一个点是否包含在当前对象内。在 Geomertry 类中已实现了一个基本版本,即通过 getBBox() 得到当前对象的矩形边框框,通过判断点是否在 Bounding Box 中而进行判断。
子类可重新该方法,进行更为精确的判断。例如对于 Circle 对象,可通过判断 point 与 圆心 radius 之间的距离是否超过圆的半径,从而得到比判断 point是否在该圆的 Bounding Box 内更为精确的结果。
clone()
该方法实现对象克隆,返回一个新的对象,建议子类重写该方法,实现对象的深度复制。
toData()
该方法以JSON格式返回对象信息,详见下面各类对象中的‘数据格式’章节。
其他
除了上述这些基本方法之外,下面这几个方法也很常用,这些方法将在进阶篇其他章节讲述。
| 名称 | 说明 |
|---|---|
| setContextStyle(ctx, style) | 设置画板样式 |
| getColor(param, ctx) | 获取填充/描边的颜色值或特殊效果 |
| strokeAndFill(ctx) | 描边和填充 |
| translate(dx, dy) | 对象平移 |
| scale(sx, sy, opt_anchor) | 对象缩放 |
| rotate(angle, opt_anchor) | 对象旋转 |
| moveTo(dx, dy) | 将对象移动至某点 |
| transform(matrix) | 坐标变换 |
(2) 点(Point)
点是一种最简单的几何形状,其信息包括:x坐标、y坐标、大小size和旋转角度rotation等。 anyGraph 中点的属性如下表所示:
| 名称 | 类型 | 说明 |
|---|---|---|
| uid | String | 唯一ID |
| type | String | 类型 |
| x | float | X坐标值 |
| y | float | Y坐标值 |
| size | float | 大小 |
| rotation | float | 旋转角度 |
| pointType | int | 点类型 |
| centerAsOrigin | Boolean | 坐标点是否位于图标的中心,默认:true |
| style | Object | 样式 |
| properties | Object | 属性 |
初始化
1 | constructor(options) |
该类的构造函数接受一个 Object 类型的参数,其值包含了上述所有属性 (type除外) 。
空间信息
点是0维的几何体,其空间属性通过坐标 x 和 y 确定位置,通过 size 确定大小,这几个属性均为浮点类型,其格式如下:
1 | { "x":50, "y":20, "size":5 } |
示例
下面这个示例在图形增加了一个点对象,通过图层数据源的 add()方法增加至图层中,源代码如下:
1 | <script type="module"> |
图形
,在渲染点时 anyGraph 提供了内置类型和图标两种渲染方式。
内置点类型
根据点类型(pointType)的值渲染为不同的形状。 anyGraph 提供了20种不同形状,如下图所示:
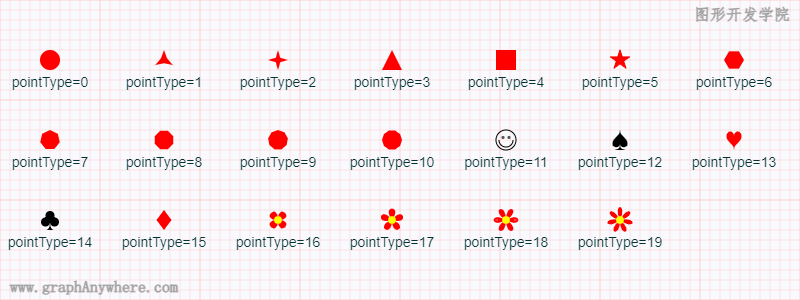
在构造Point对象时指定pointType属性,其取值范围为 0~19,即可将点渲染为内置形状。其数据格式定义如下:
1 | [ |
图标
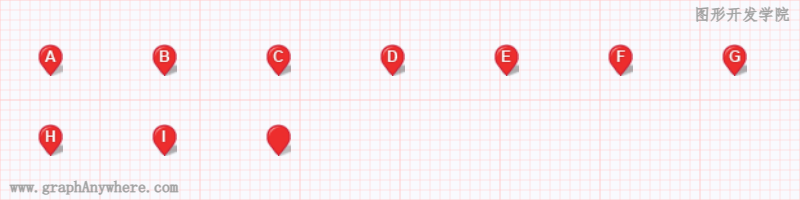
在构造Point对象时指定src属性,将其指向一个图标文件路径,即可将点渲染为图标。其数据格式定义如下:
1 | [ |
默认情况下点坐标(x,y)位于图标的中心,可通过centerAsOrigin=false将点坐标指向图标的底部中央位置。
如果没有指定src属性,也没有指定pointType属性,则按照 pointType 等于0,输出一个 “填充圆” 。
样式
通过从 Geometry 类继承的 style 属性指定渲染样式,可通过 getStyle() 获取样式,或通过 setStyle() 设置样式,该类样式包括了以下属性:
| 名称 | 类型 | 说明 |
|---|---|---|
| color | StringColor | 描边颜色 |
| fillColor | StringColor | 填充颜色 |
| lineWidth | float | 线宽 |
(3) 折线(Polyline)
折线由若干点连接而成,其中每两个点之间称之为线段(lineSegment)。在GIS中折线对应类型为 LineString,在SVG中对应类型为 polyline 或 line。 anyGraph 中折线的属性如下表所示:
| 名称 | 类型 | 说明 |
|---|---|---|
| uid | String | 唯一ID |
| type | String | 类型 |
| rotation | float | 旋转角度 |
| coords | Array |
坐标数组 |
| style | Object | 样式 |
| properties | Object | 属性 |
初始化
1 | constructor(options) |
该类的构造函数接受一个 Object 类型的参数,其值包含了上述所有属性 (type除外) 。
空间信息
折线类的空间属性 通过坐标 coords 属性确定,其格式为坐标点数组类型,而各个点也是一个浮点类型数组,其格式如下:
1 | [[50,50], [150,80], [250,50], [350,80], [450,50]] |
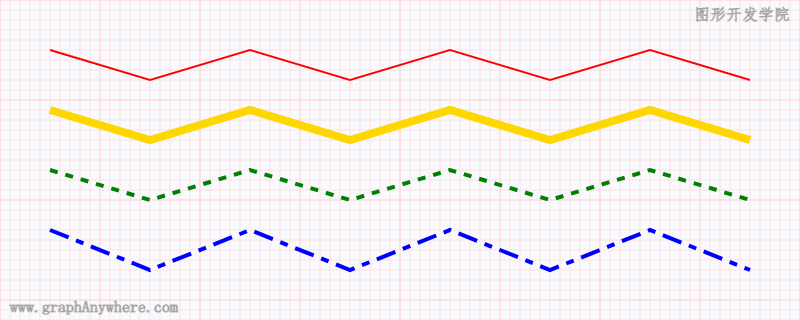
示例
下面这个示例在图形增加了几个折线对象,通过图层数据源的 add()方法增加至图层中,源代码如下:
1 | <script type="module"> |
这段代码运行的结果如下图所示:
数据格式
anyGraph 中折线类的数据格式如下:
1 | [ |
样式
通过从 Geometry 类继承的 style 属性指定渲染样式,可通过 getStyle() 获取样式,或通过 setStyle() 设置样式,该类样式包括了以下属性:
| 名称 | 类型 | 说明 |
|---|---|---|
| color | StringColor | 颜色 |
| lineWidth | float | 线宽 |
| dash | Array |
虚线样式 |
| dashOffset | int | 虚线偏移量 |
| lineCap | String | 描边属性,边框终点的形状 |
| lineJoin | String | 连接属性,控制两条描边线段之间连接属性 |
| miterLimit | int | 斜接长度 |
linecap 属性的值有三种可能值:
- butt用直边结束线段,它是常规做法,线段边界 90 度垂直于描边的方向、贯穿它的终点。(default)
- square的效果差不多,但是会稍微超出实际路径的范围,超出的大小由stroke-width控制
- round表示边框的终点是圆角,圆角的半径也是由stroke-width控制的。
lineJoin 连接属性,控制两条描边线段之间,它有三个可用的值:
- miter: 默认值,表示用方形画笔在连接处形成尖角(default)
- round: 表示用圆角连接,实现平滑效果
- bevel: 连接处会形成一个斜接
(4) 矩形(Rect)
矩形是一种常见的几何形状。 anyGraph 中矩形的属性如下表所示:
| 名称 | 类型 | 说明 |
|---|---|---|
| uid | String | 唯一ID |
| type | String | 类型 |
| x | float | X坐标值 |
| y | float | Y坐标值 |
| width | float | 宽 |
| height | float | 高 |
| rx | float | 水平轴向的圆角半径尺寸 |
| ry | float | 垂直轴向的圆角半径尺寸 |
| rotation | float | 旋转角度 |
| style | Object | 样式 |
| properties | Object | 属性 |
初始化
1 | constructor(options) |
该类的构造函数接受一个 Object 类型的参数,其值包含了上述所有属性 (type除外) 。
空间信息
矩形的空间属性通过坐标 x 和 y 确定位置,通过 width 和 height 确定大小,这几个属性均为浮点类型,其格式如下:
1 | { "x":50, "y":20, "width": 200, "height": 100 } |
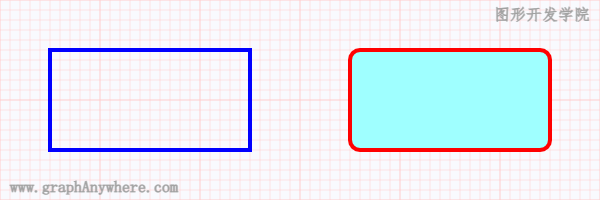
示例
下面这个示例在图形增加了一个矩形对象,通过图层数据源的 add()方法增加至图层中,源代码如下:
1 | <script type="module"> |
这段代码运行的结果如下图所示:
数据格式
anyGraph 中矩形类的数据格式如下:
1 | [ |
样式
通过从 Geometry 类继承的 style 属性指定渲染样式,可通过 getStyle() 获取样式,或通过 setStyle() 设置样式,该类样式包括了以下属性:
| 名称 | 类型 | 说明 |
|---|---|---|
| color | StringColor | 描边颜色, 当值等于 “none” 时表示不用描边 |
| lineWidth | float | 描边线宽 |
| fillColor | StringColor | 填充颜色 |
| fillStyle | int | 填充风格,1为填充,2为不填充 |
| dash | Array |
虚线样式 |
| dashOffset | int | 虚线偏移量 |
| lineCap | String | 描边属性,边框终点的形状 |
| lineJoin | String | 连接属性,控制两条描边线段之间连接属性 |
| miterLimit | int | 斜接长度 |
(5) 多边形(Polygon)
多边形是一种基本的几何图形,由三个或三个以上的顶点坐标连线所围成的封闭图形。 anyGraph 中矩形的属性如下表所示:
| 名称 | 类型 | 说明 |
|---|---|---|
| uid | String | 唯一ID |
| type | String | 类型 |
| rotation | float | 旋转角度 |
| coords | Array |
坐标数组 |
| style | Object | 样式 |
| properties | Object | 属性 |
初始化
1 | constructor(options) |
该类的构造函数接受一个 Object 类型的参数,其值包含了上述所有属性 (type除外) 。
空间信息
多边形的空间属性是通过多个 LineRing 组成, 第一个环是多边形的外边界,所有后续环都是内孔。LineRing(线环)是一种闭合的 LineString(折线)。其格式如下:
1 | [ |
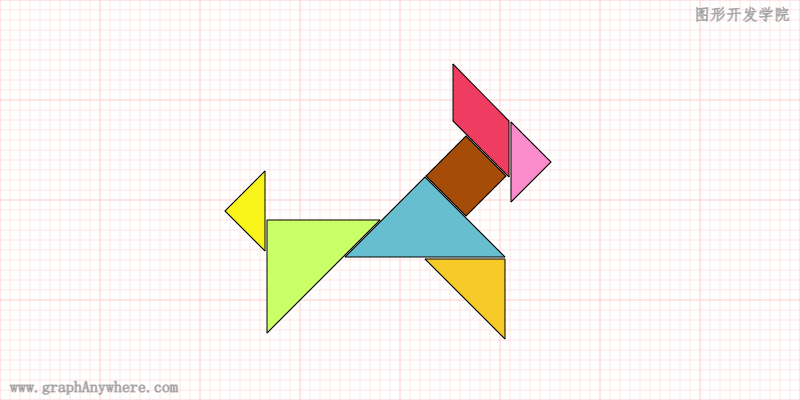
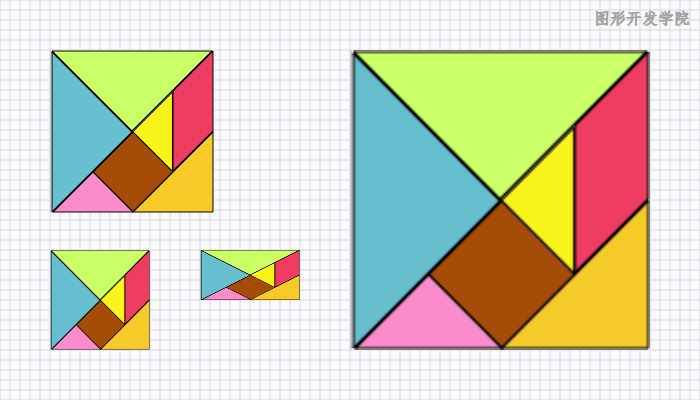
示例1
下面这个示例在图形增加了7个多边形对象(七巧板),通过图层数据源的 loadData()方法增加至图层中,源代码如下:
1 | <script type="module"> |
这段代码运行的结果如下图所示:
示例2
下面这个示例在图形增加了一个带洞的多边形对象,通过图层数据源的 add()方法增加至图层中,源代码如下:
1 | <script type="module"> |
这段代码运行的结果如下图所示:
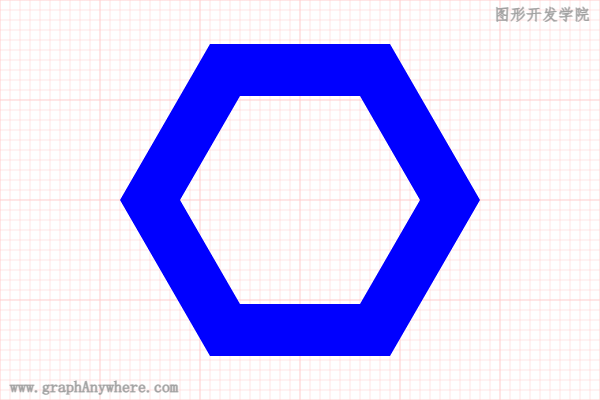
注意:要绘制这种带孔的多边形,需注意坐标的顺序,该图中的外框多边形坐标是顺时针的,内孔多边形坐标是逆时针的。
数据格式
anyGraph 中多边形类的数据格式如下:
1 | [ |
样式
多边形样式属性与矩形样式属性相同。
(6) 图像(Image)
图像(位图)是指由像素(图片元素)组成的矩形。这些像素可以进行不同的排列和染色以构成图像,每个像素都有固定的位置和特定的颜色值,它们共同决定了图像的形状、颜色和细节。 anyGraph 中图像的属性如下表所示:
| 名称 | 类型 | 说明 |
|---|---|---|
| uid | String | 唯一ID |
| type | String | 类型 |
| rotation | float | 旋转角度 |
| x | float | X坐标值 |
| y | float | Y坐标值 |
| width | float | 宽 |
| height | float | 高 |
| style | Object | 样式 |
| properties | Object | 属性 |
初始化
1 | constructor(options) |
该类的构造函数接受一个 Object 类型的参数,其值包含了上述所有属性 (type除外) 。
空间信息
图像的空间属性通过坐标 x 和 y 确定位置,通过 width 和 height 确定大小,这几个属性均为浮点类型,其格式如下:
1 | { "x":50, "y":20, "width": 200, "height": 100 } |
示例
下面这个示例在图形中增加了几个图像对象,通过图层数据源的 add()方法增加至图层中,源代码如下:
1 | <script type="module"> |
这段代码运行的结果如下图所示:
数据格式
anyGraph 中图像类的数据格式如下:
1 | [ |
样式
通过从 Geometry 类继承的 style 属性指定渲染样式,可通过 getStyle() 获取样式,或通过 setStyle() 设置样式,该类样式包括了以下属性:
| 名称 | 类型 | 说明 |
|---|---|---|
| borderColor | StringColor | 颜色 |
| border | float | 线宽 |
| imageSmoothingEnabled | Boolean | 是否平滑 |
| imageSmoothingQuality | String | 平滑度 |
imageSmoothingQuality 的可选值包括:
- “low” : 低;
- “medium” :中
- “high” : 高
(7) 文本(Text)
在图形系统中,文本对象通常指的是在图形界面中呈现的文字元素。用于标注、说明、展示信息等目的。因此图形基本形状中还应包括文本类型,从而方便的在图形中绘制文字。 anyGraph 中文本的属性如下表所示:
| 名称 | 类型 | 说明 |
|---|---|---|
| uid | String | 唯一ID |
| type | String | 类型 |
| rotation | float | 旋转角度 |
| x | float | X坐标值 |
| y | float | Y坐标值 |
| vectorSize | Boolean | 是否为矢量字体 |
| width | float | 文字宽度 |
| height | float | 文字高度 |
| maxWidth | float | 文字可显示的最大宽度 |
| vertical | Boolean | 是否垂直排列 |
| style | Object | 样式 |
| properties | Object | 属性 |
说明:
- 文字大小优先由 style.fontSize 指定;
- vectorSize的缺省属性是true,即文字大小跟随着图形的缩放而缩放;
- 如果没有指定fontSize,也可由 width 和 height 属性确定文字大小;
初始化
1 | constructor(options) |
该类的构造函数接受一个 Object 类型的参数,其值包含了上述所有属性 (type除外) 。
空间信息
文本的空间属性通过坐标 x 和 y 确定位置,通过样式中的 fontSize 确定大小,这几个属性均为浮点类型。此外样式中的水平对齐 textAlign和垂直对齐 textBaseline 也会影响文本的位置,其格式如下:
1 | { "x":50, "y":20, "style": {"fontSize": 100 }} |
示例
下面这个示例在图形增加了几个文本对象,通过图层数据源的 add()方法增加至图层中,源代码如下:
1 | <script type="module"> |
这段代码运行的结果如下图所示:
数据格式
anyGraph 中文本类的数据格式如下:
1 | [ |
样式
通过从 Geometry 类继承的 style 属性指定渲染样式,可通过 getStyle() 获取样式,或通过 setStyle() 设置样式,文本样式包括了以下属性:
| 名称 | 类型 | 说明 |
|---|---|---|
| color | StringColor | 颜色 |
| lineWidth | float | 线宽 |
| fontName | String | 字体名称 |
| fontSize | int | 字体大小 |
| fontItalic | Boolean | 是否斜体 |
| fontBold | Boolean | 是否粗体 |
| fontWeight | String | 粗细程度 |
| textAlign | String | 水平对齐方式 |
| textBaseline | String | 垂直对齐方式 |
| minFontSize | int | 最小显示的字号大小 |
| fillPrior | Boolean | 是否强制填充文本 |
| letterSpacing | int | 字间距 |
| wordSpacing | int | 字母间距 |
| fontBorder | Boolean | 是否带有边框 |
| borderColor | StringColor | 边框颜色 |
| borderOpacity | float | 边框透明度 |
注意:当图形缩放导致字体大小小于minFontSize时,不显示该文本。
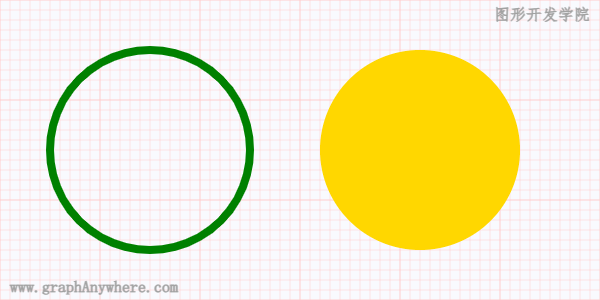
(8) 圆(Circle)
圆是一种基本的几何图形,它是由所有到固定点(即圆心)距离相等的点组成的集合。 anyGraph 中矩形的属性如下表所示:
| 名称 | 类型 | 说明 |
|---|---|---|
| uid | String | 唯一ID |
| type | String | 类型 |
| x | float | X坐标值 |
| y | float | Y坐标值 |
| radius | float | 半径 |
| startAngle | float | 圆弧的起始点,x 轴方向开始计算,单位以弧度表示 |
| endAngle | float | 圆弧的终点,单位以弧度表示 |
| anticlockwise | Boolean | 是否逆时针方向绘制圆(默认值为: false) |
| style | Object | 样式 |
| properties | Object | 属性 |
初始化
1 | constructor(options) |
该类的构造函数接受一个 Object 类型的参数,其值包含了上述所有属性 (type除外) 。
空间信息
圆的空间属性是由圆心(x,y)和半径(radius)确定,此外圆弧的起始点 startAngle 属性和圆弧的终点 endAngle 属性也会影响圆的形状。其格式如下:
1 | { "x":300, "y":220, "radius": 200 } |
示例
下面这个示例在图形增加了两个圆对象,其中一个是描边圆(空心),另一个是填充的圆(实心),通过图层数据源的 add()方法增加至图层中,源代码如下:
1 | <script type="module"> |
这段代码运行的结果如下图所示:
数据格式
anyGraph 中圆的数据格式如下:
1 | [ |
样式
圆的样式属性与矩形样式属性相同。
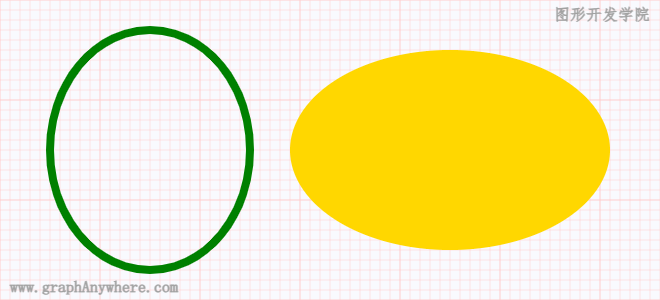
(9) 椭圆(Ellipse)
椭圆是由所有满足到两个定点(即焦点)距离之和等于常数的点组成的平面图形。 anyGraph 中矩形的属性如下表所示:
| 名称 | 类型 | 说明 |
|---|---|---|
| uid | String | 唯一ID |
| type | String | 类型 |
| x | float | X坐标值 |
| y | float | Y坐标值 |
| radiusX | float | 椭圆长轴的半径 |
| radiusY | float | 椭圆短轴的半径 |
| startAngle | float | 圆弧的起始点,x 轴方向开始计算,单位以弧度表示 |
| endAngle | float | 圆弧的终点,单位以弧度表示 |
| anticlockwise | Boolean | 是否逆时针方向绘制圆(默认值为: false) |
| rotation | float | 旋转角度 |
| style | Object | 样式 |
| properties | Object | 属性 |
初始化
1 | constructor(options) |
该类的构造函数接受一个 Object 类型的参数,其值包含了上述所有属性 (type除外) 。
空间信息
椭圆的空间属性是由圆心(x,y)和半径(radius)确定。其格式如下:
1 | { "x":300, "y":220, "radiusX": 200, "radiusY": 120 } |
示例
下面这个示例在图形增加了两个椭圆对象,通过图层数据源的 add()方法增加至图层中,源代码如下:
1 | <script type="module"> |
这段代码运行的结果如下图所示:
数据格式
anyGraph 中椭圆的数据格式如下:
1 | [ |
样式
椭圆的样式属性与矩形样式属性相同。
“图形系统实战开发-进阶篇 第四章 图形基本形状” 的内容讲解到这里就结束了,如果觉得对你有帮助有收获,可以关注我们的官方账号,持续关注更多精彩内容。
本文为“图形开发学院”(graphanywhere.com)网站原创文章,遵循CC BY-NC-ND 4.0版权协议,商业转载请联系作者获得授权,非商业转载请附上原文出处链接及本声明。


0评论